Graphs
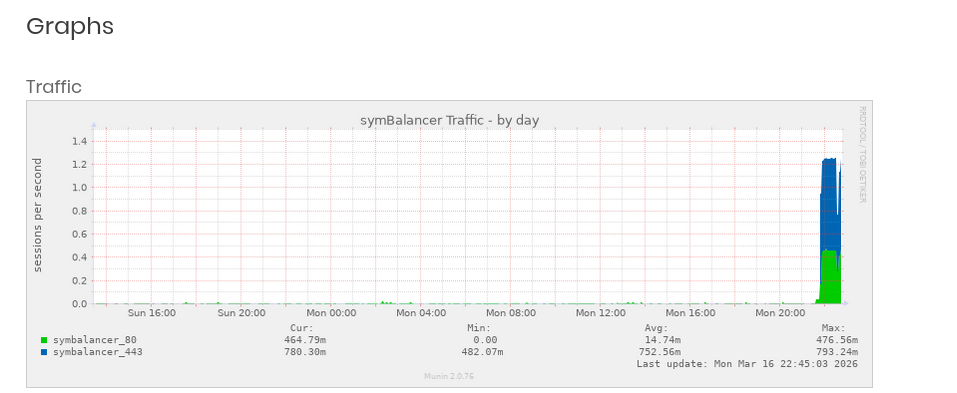
Graphs are the same as with slices, except for an additional one up top, Traffic. This graph displays traffic per port, over time. The port names are shown in the form of symbalancer_PORT. For example, port 80 will be named symbalancer_80. Each port is a unique color to make it easy to differentiate.
Like other graphs, clicking them will open a page which includes additional graphs for monthly and yearly.
Understanding Graphs
An important note on reading the graphs: it’s good to know the ‘m’ means “milli”:
Milli (symbol m) is a prefix in the metric system denoting a factor of one thousandth
The graphs (by default) read a counter every 5 minutes (300 seconds), and calculates the average between the two last reads. For example, 66m means: .066*300 = 19.8 accesses within a five minute period.
So the formula for 66m is: (66/1000)*60*5=19.8 accesses in 5 minutes. Or in other words, just move the decimal three places left (adding zeroes as reqired), and multiply that by 300 seconds (60s*5minutes = 300seconds).